关于这张图
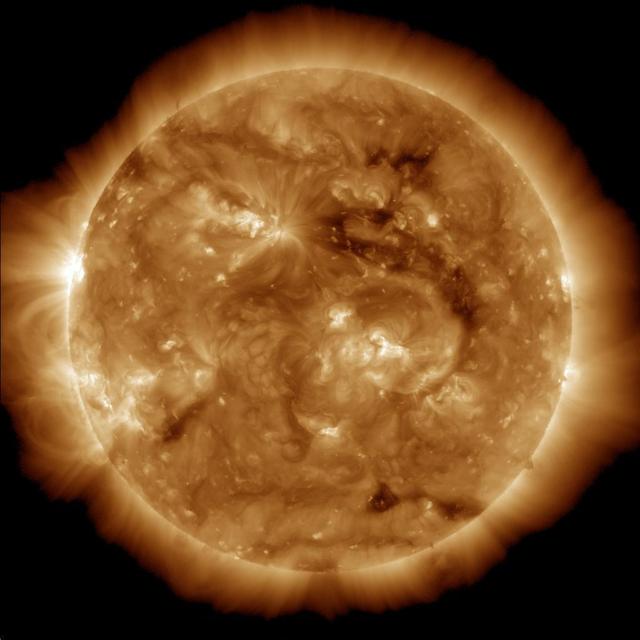
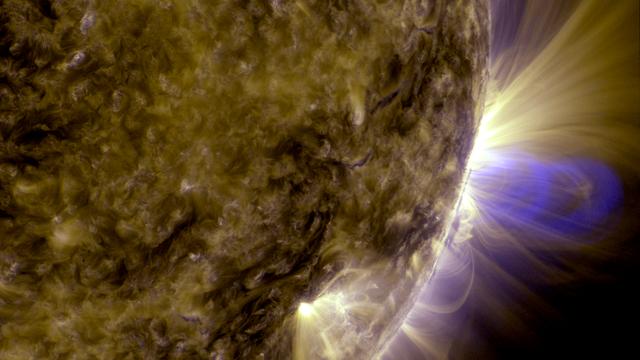
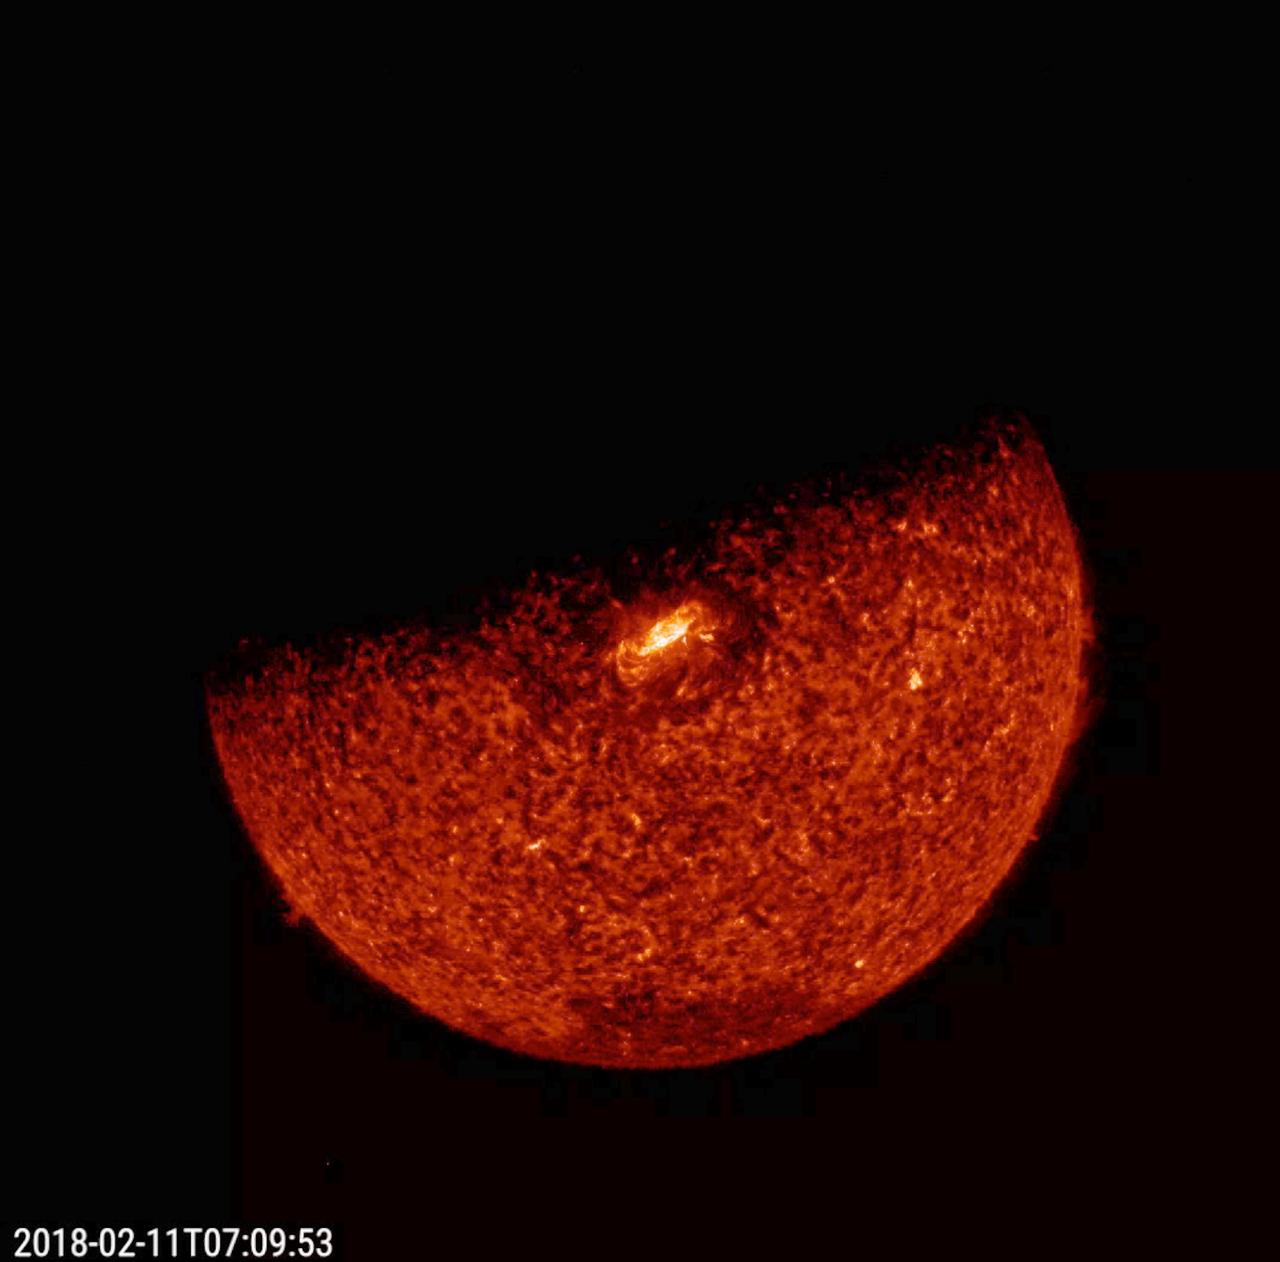
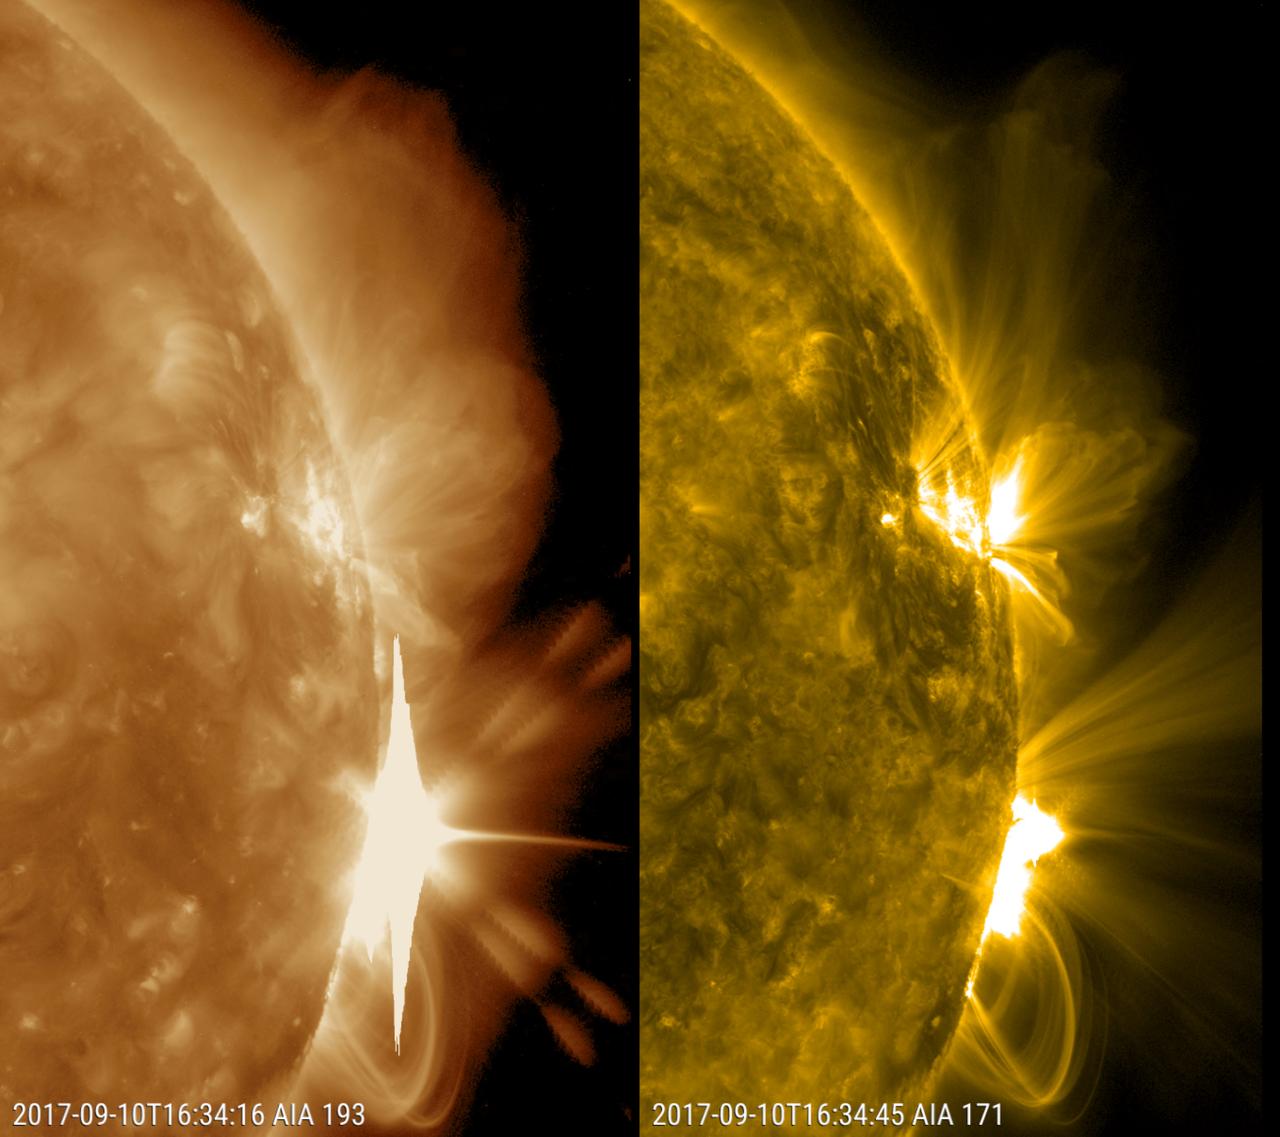
This image, is a composite of 23 separate images spanning the period of January 11, 2015 to January 21, 2016. It uses the SDO AIA wavelength of 171 angstroms and reveals the zones on the sun where active regions are most common during this part of the solar cycle. There are wallpapers sized for some phones and tablets available to download here: <a href="https://svs.gsfc.nasa.gov/cgi-bin/details.cgi?aid=12144#.Vr4_WtIQzrs.twitter" rel="nofollow">svs.gsfc.nasa.gov/cgi-bin/details.cgi?aid=12144#.Vr4_WtIQ...</a> Credit: NASA's Goddard Space Flight Center/SDO/S. Wiessinger <b><a href="http://ww…